Smart Cultural Tourism Scenic Area Operation Monitoring Screen AI Image Prompt
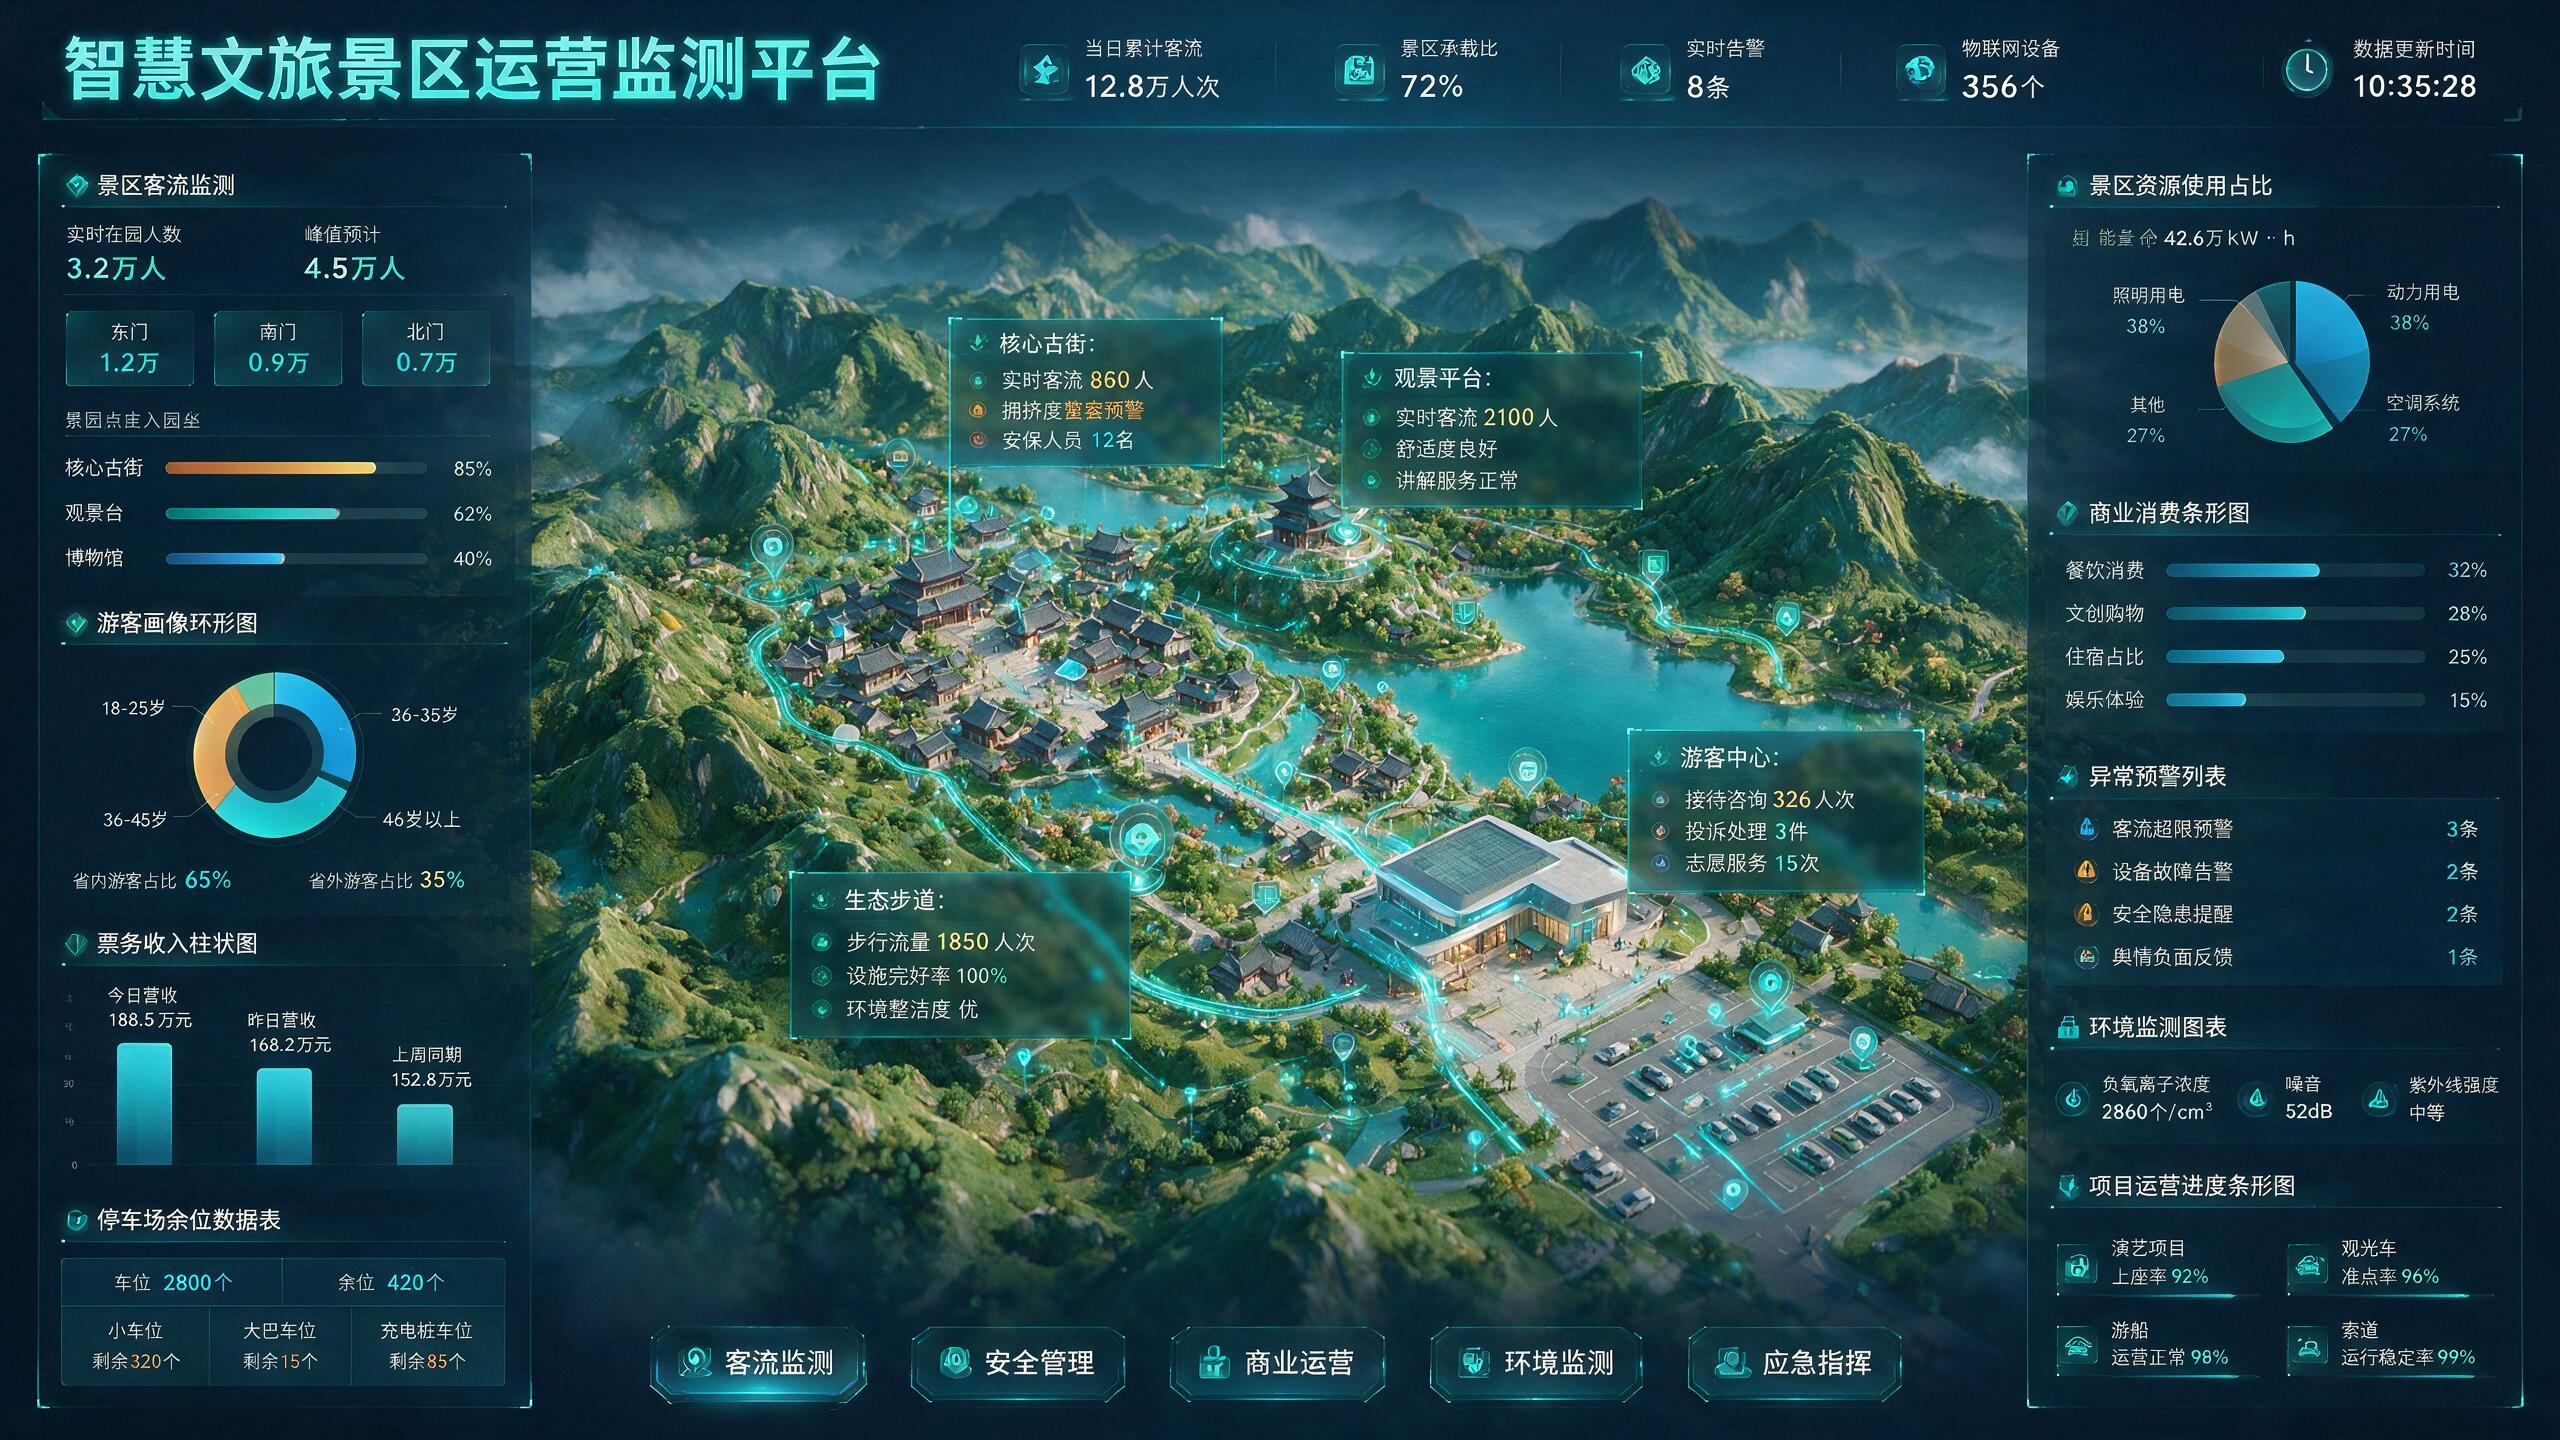
Futuristic cultural tourism scenic area operation monitoring data screen. The overall style continues the deep-sea blue, ecological green, and cyan glowing UI of the reference image. In the center is a high-precision 3D digital twin model of the entire scenic area, including mountains, lakes, ancient architecture groups, visitor centers, walking trails, parking lots, and core attractions. Tour routes run through the entire map as glowing flow lines, with multiple intelligent monitoring points and floating data cards distributed. The top title is "Smart Cultural Tourism Scenic Area Operation Monitoring Platform". The top core information displays: cumulative visitor flow of 128,000 person-times today, capacity utilization 72%, 8 real-time alerts, 356 connected IoT devices, data update time 10:35:28. The left modules sequentially display: Scenic area visitor flow monitoring: real-time in-park visitors 32,000, peak expected 45,000, and entrance volumes (East Gate 12,000, South Gate 9,000, North Gate 7,000), main attraction congestion levels (Core Ancient Street 85%, Observation Deck 62%, Museum 40%). Visitor profile ring chart: age distribution 18-25: 28%, 26-35: 35%, 36-45: 22%, 46+: 15%, and labeled provincial visitors 65%, out-of-province visitors 35%. Ticket sales bar chart: today's revenue 1.865 million yuan, yesterday 1.682 million yuan, same period last week 1.528 million yuan. Parking lot remaining spaces table: total spaces 2,800, remaining 420, including 320 car spaces, 15 bus spaces, 85 charging spaces. The right modules sequentially display: Scenic area resource usage proportion: total energy consumption 426,000 kWh, of which lighting electricity 38%, power electricity 25%, air conditioning 27%, other 10%. Commercial consumption bar chart: dining 32%, cultural and creative shopping 28%, accommodation 25%, entertainment experience 15%. Abnormal alert list: 3 visitor overload warnings, 2 equipment fault alarms, 2 safety hazard reminders, 1 negative public opinion feedback. Environmental monitoring chart: negative oxygen ion concentration 2860 ions/cm³, noise 52dB, UV intensity moderate. Project operation progress bar chart: performance project attendance rate 92%, sightseeing bus punctuality rate 96%, cruise ship normal operation rate 98%, cable car stable operation rate 99%. Multiple monitoring points on the central map pop up floating data cards, e.g., "Core Ancient Street: real-time visitors 8,500, congestion orange alert, 12 security personnel", "Observation Deck: real-time visitors 2,100, comfort level good, interpretation service normal", "Visitor Center: received 326 consultation person-times, 3 complaints handled, 15 voluntary services", "Ecological Trail: walking flow 1,850 person-times, facility integrity rate 100%, excellent environmental cleanliness". At the bottom, futuristic function menu buttons are set: visitor flow monitoring, safety management, commercial operation, environmental monitoring, emergency command. The overall picture requires rich information, clear hierarchy, legible data text, prominent central visual, and a professional visual effect of high-end digital twin, smart cultural tourism command center, and future smart large screen.
Content: Structure: overall style + central 3D digital twin + top title/data + left/right chart modules + bottom menu, with lighting, UI style, composition, data visualization, dense info, default landscape.
Pros: Clear hierarchy; rich specific data.
Cons: Information overload may weaken focus; strongly depends on reference image.
Reference image: Clearly depends on reference image
Source materials are collected from publicly accessible web pages. Contact us if a rights issue needs review. Copyright & Privacy