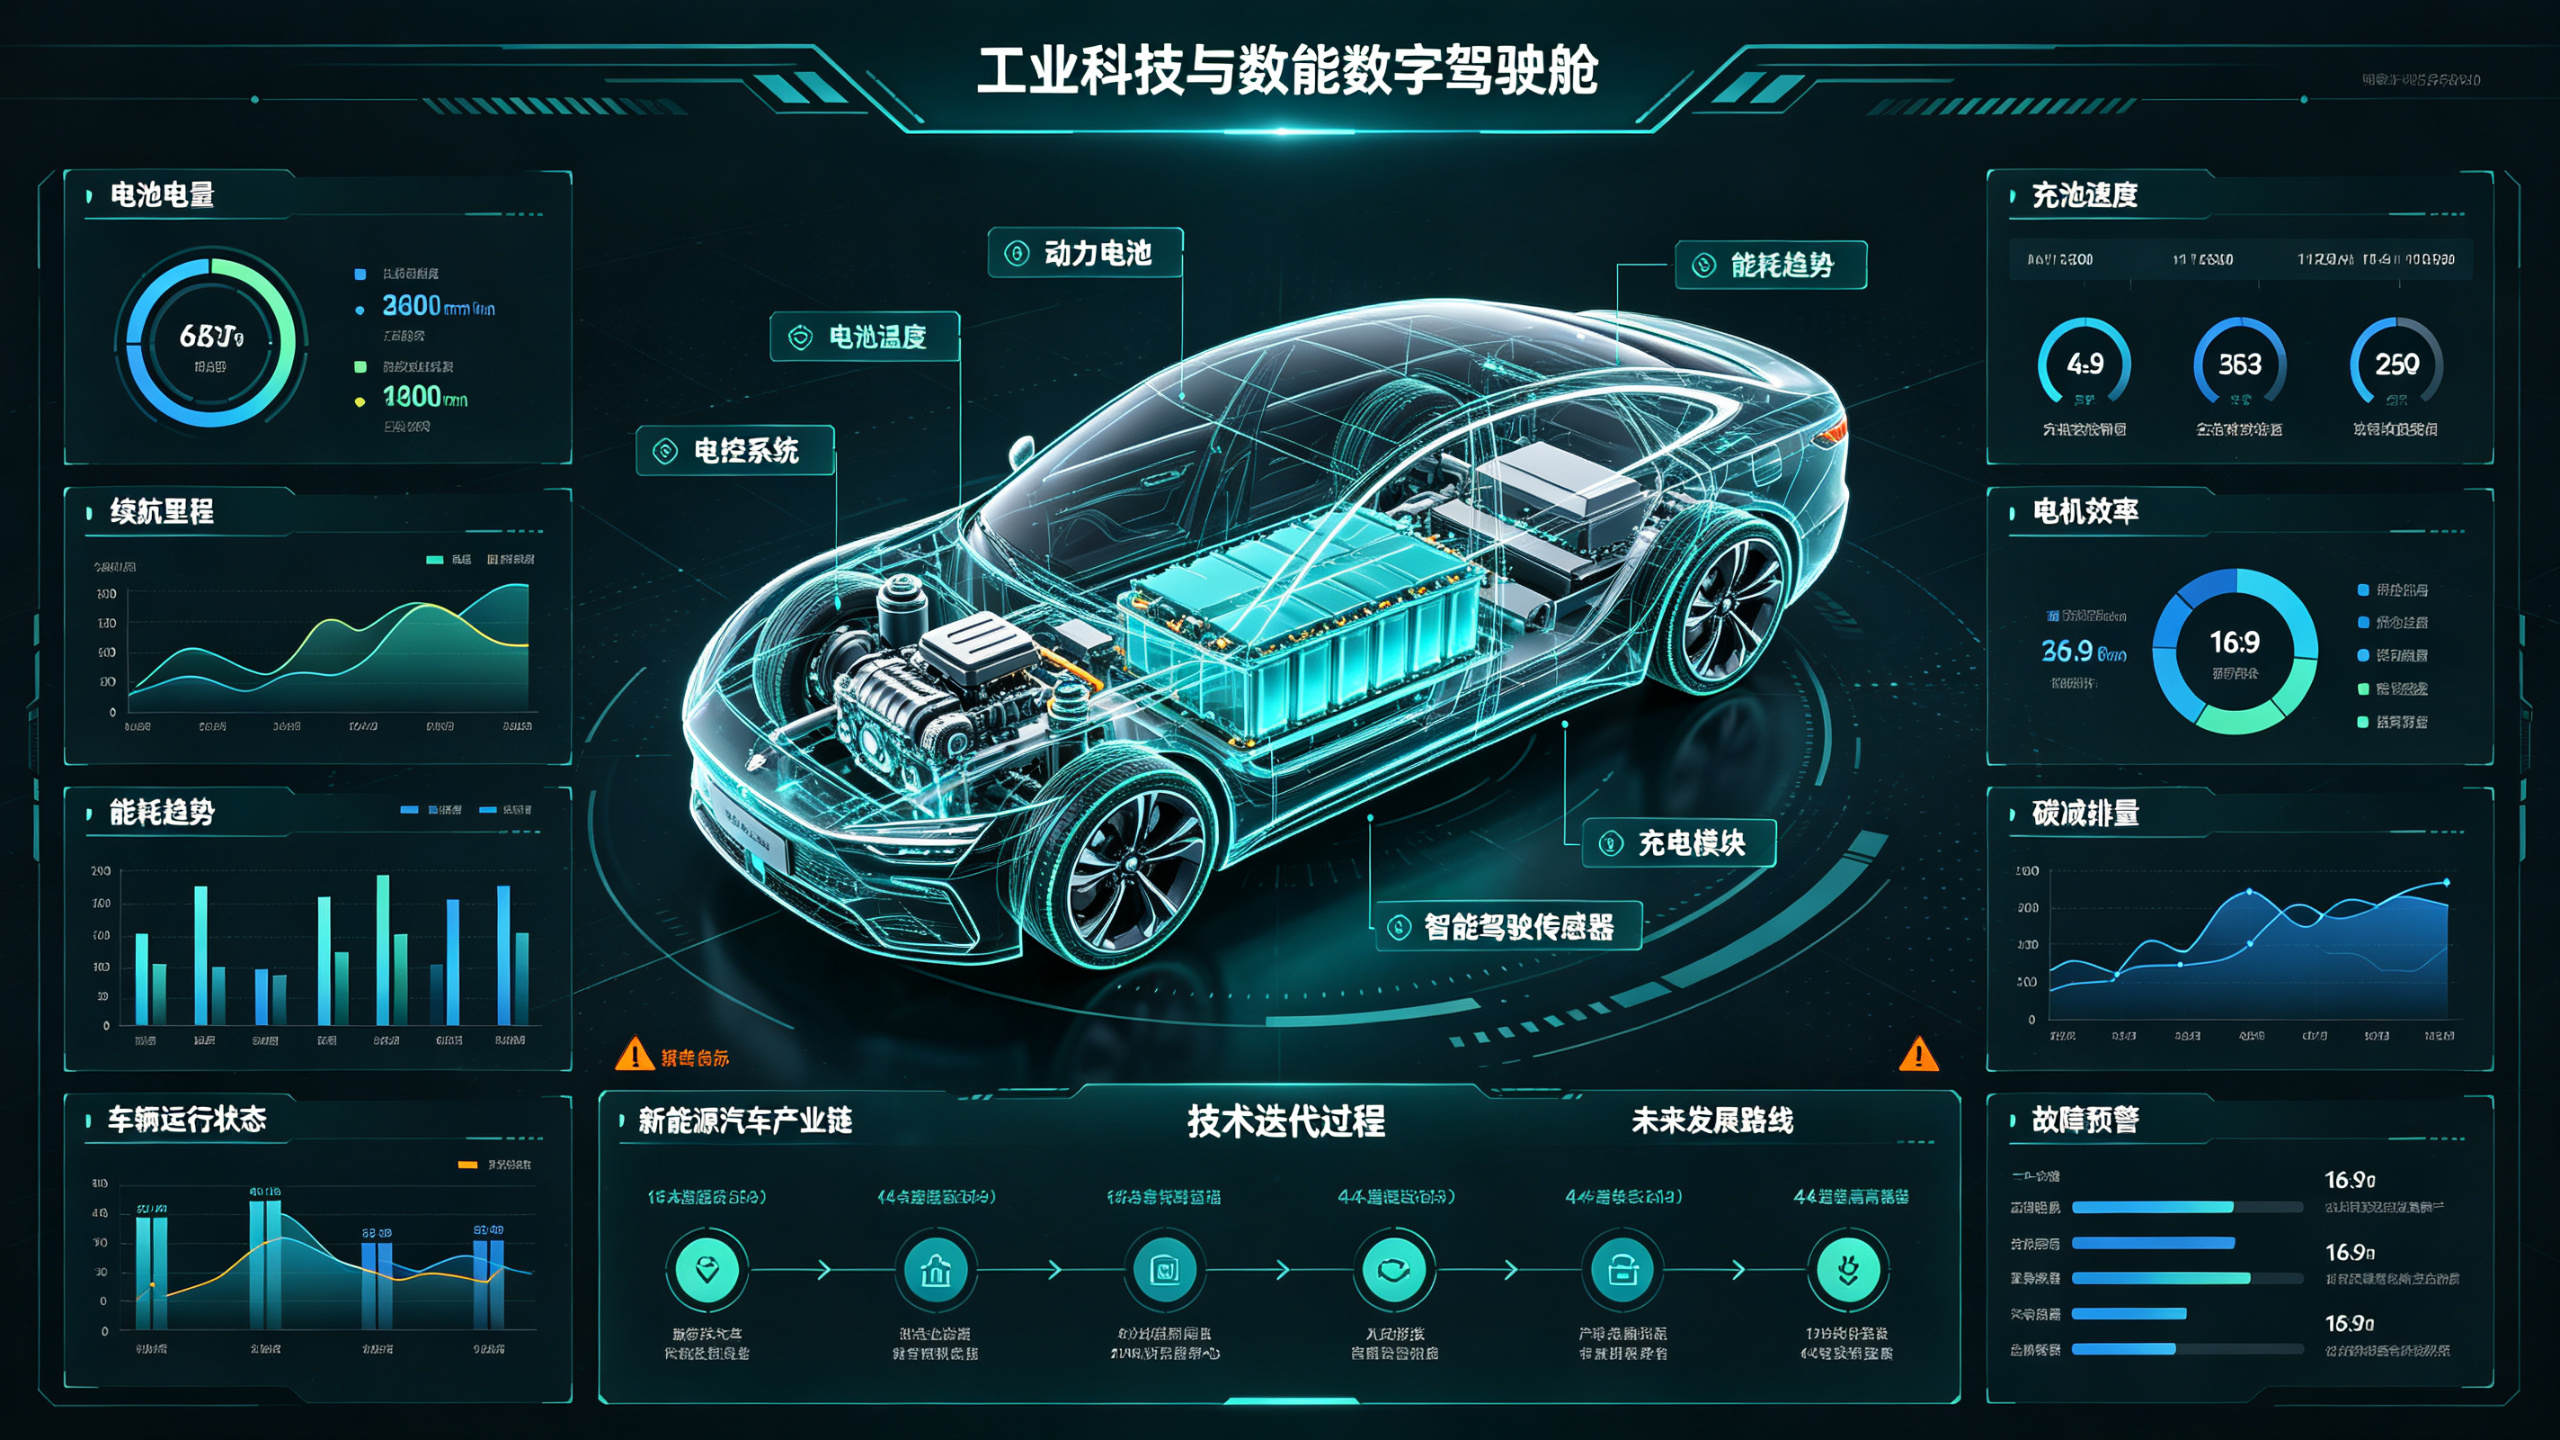
NEV Industry Data Visualization Dashboard UI AI Image Prompt
Design an industrial data visualization dashboard UI centered on new energy vehicle technology. The center of the screen features a 3D model of a new energy vehicle as the main visual, with an exploded view showing the power battery, electric motor, electronic control system, intelligent driving sensors, and charging module. On the left and right sides, display battery level, driving range, energy consumption trends, battery temperature, charging speed, motor efficiency, vehicle operating status, carbon emission reduction, and fault warnings; on the lower section, display the new energy vehicle industry chain, technology iteration process, and future development roadmap. The overall visual style combines industrial technology and a digital cockpit, with a dark background accented by teal, blue, white, and orange warning information. Charts are rigorous and the hierarchy is clear. 16:9 horizontal composition, 4K UHD, suitable for display in automobile showrooms and enterprise command centers. The main elements have been redesigned with slight variations in details and composition. No author signature, no watermark, no real brand names.
Content: Structure: subject (3D NEV + exploded view) → side panels → lower industry chain/roadmap; industrial tech & digital cockpit style, dark bg with teal/blue/white/orange; 16:9, 4K; redesigned, no signatures/brands.
Pros: Clear hierarchy; suited for large-screen display.
Cons: Many elements may require density trade-offs.
Reference image: No obvious reference-image dependency
Source materials are collected from publicly accessible web pages. Contact us if a rights issue needs review. Copyright & Privacy