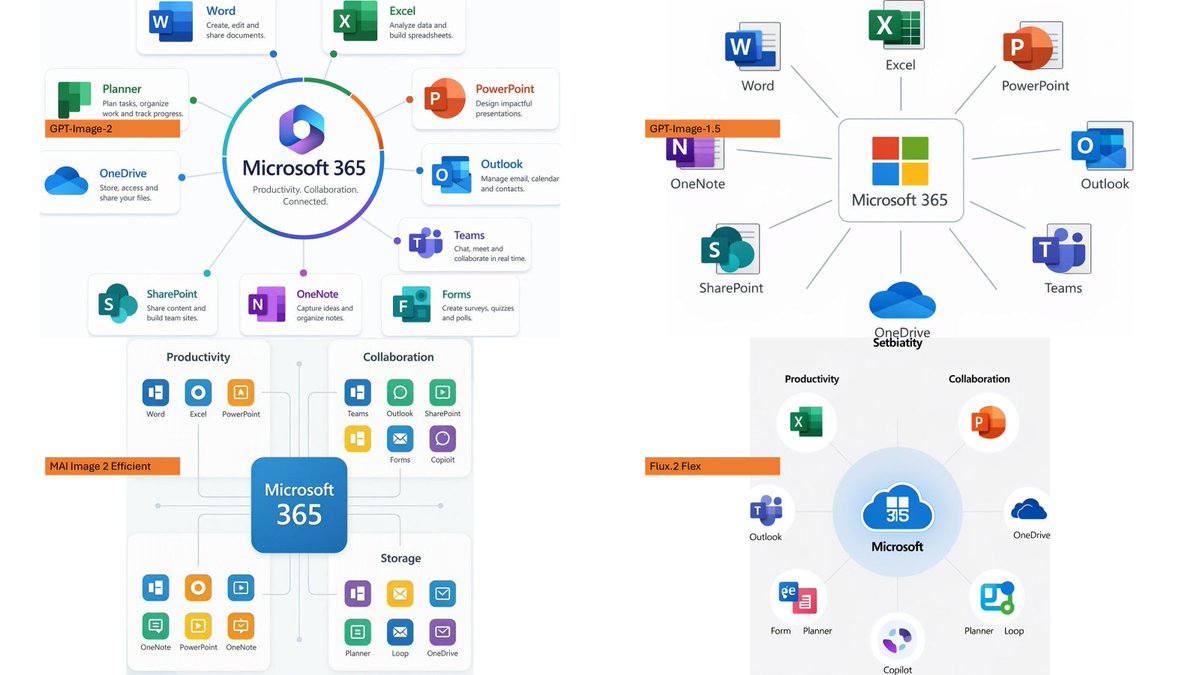
Four Models Render Microsoft 365 Infographic Comparison AI Image Prompt
Using the provided reference image as a benchmark for a clean, readable business infographic style, create a 16:9 comparison slide that demonstrates how different image generation models render an infographic about Microsoft 365. Replace the Japanese DX report content with four separate sample infographic outputs arranged in a 2×2 grid on a white background. Layout: Use exactly 4 panels, each showing a different Microsoft 365 ecosystem diagram, with a small horizontal orange model label near the left side of that panel. The four labels must be: 1) GPT-Image-2, 2) GPT-Image-1.5, 3) MAI Image 2 Efficient, and 4) Flux.2 Flex. Panel content: Each panel should visualize Microsoft 365 at the center with surrounding app icons and labels. Include recognizable Microsoft-style app tiles/icons such as Word, Excel, PowerPoint, Outlook, Teams, OneDrive, SharePoint, OneNote, Forms, Planner, Loop, and Copilot where appropriate. Make the top-left panel the most polished and text-readable, with a circular hub-and-spoke diagram and concise app descriptions. Make the top-right panel simpler, with icons connected to a central Microsoft 365 box. Make the bottom-left panel look like a structured category chart with Productivity, Collaboration, and Storage sections. Make the bottom-right panel look like a softer radial diagram with category headings and some imperfect or slightly inconsistent labels to imply model comparison. Style: Clean corporate SaaS infographic aesthetic, lots of white space, thin gray connector lines, Microsoft-like blue/green/orange/purple icon colors, crisp readable English text. Preserve the reference image’s practical business-document feel, but do not recreate its Japanese government-report layout, red warning sections, arrows, or original text. Constraints: Show exactly four model comparison examples, no extra title banner, no watermark, no Japanese text, and keep all text legible enough to compare model performance.
Content: Structure: 2x2 grid comparison slide with 4 panels, each with orange model label; top-left: polished hub-and-spoke, top-right: simple icon links, bottom-left: structured category chart, bottom-right: soft radial diagram; style: clean corporate infographic, white bg, thin gray lines, Microsoft icon colors, clear English.
Pros: Well-defined layout and differentiated panel designs for model comparison
Cons: Heavily relies on reference image style; template-like
Reference image: Explicitly depends on reference image
Curated from publicly available creative examples. Prompts and commentary are edited and organized by this site. Please contact us with any rights concerns. Copyright & Privacy