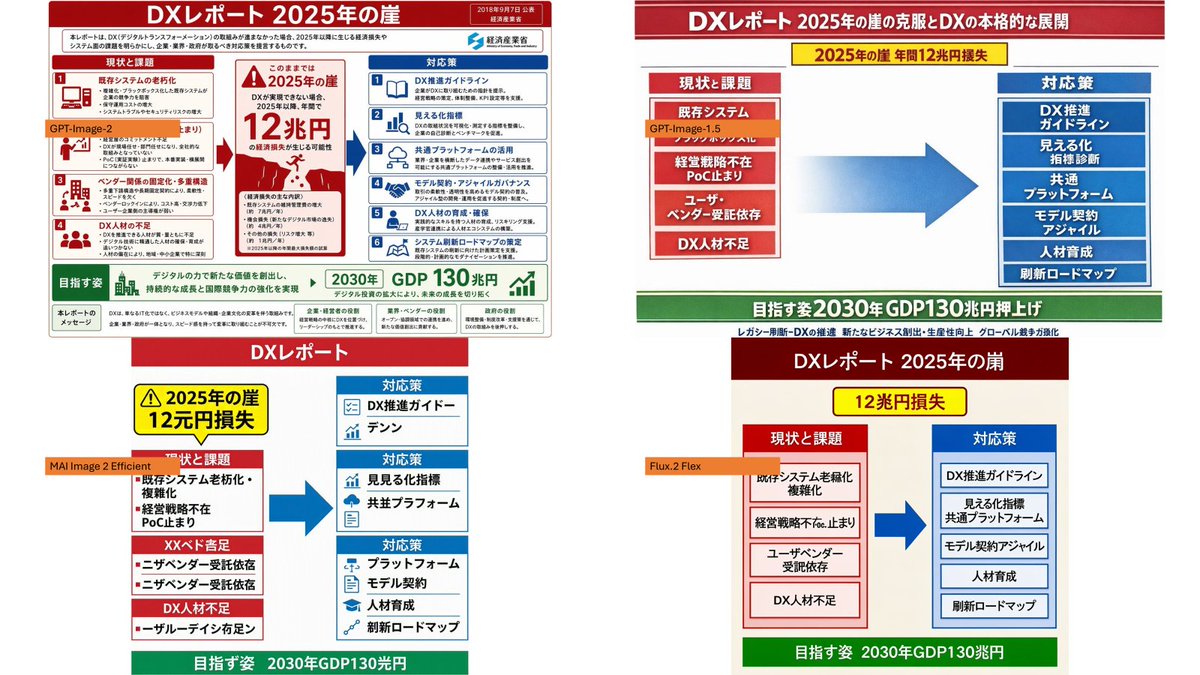
Japanese DX Report Infographic Model Comparison Collage AI Image Prompt
Using the provided reference image as the source infographic, create a 16:9 white-background comparison collage showing how different image models reproduce the same Japanese DX Report infographic. Layout: Arrange exactly 4 discrete panels in a 2×2-style collage: top-left, top-right, bottom-left, bottom-right. Keep generous white spacing between panels. Panels: 1. Top-left: show a mostly faithful smaller copy of the reference infographic, preserving the dense Japanese text, red/blue/green government-report layout, central “2025 cliff / 12 trillion yen loss” warning, left-side issues, right-side countermeasures, and bottom 2030 GDP goal. Add an orange label reading GPT-Image-2 over the left-middle area. 2. Top-right: create a cleaner simplified ponchi-e style version of the same content with a red title bar, a yellow warning strip, a red stacked “current issues” box on the left, a large blue arrow in the center, a blue stacked “countermeasures” box on the right, and a green goal bar at the bottom. Add an orange label reading GPT-Image-1.5 near the left issue box. 3. Bottom-left: create a more distorted simplified vertical version with a red “DX Report” header, yellow warning box, red issue blocks on the left, blue countermeasure boxes on the right, a large blue arrow, and green bottom goal bar. Add an orange label reading MAI Image 2 Efficient across the left side. 4. Bottom-right: create a simplified beige-background version with a dark red header, yellow “12 trillion yen loss” warning, red issue column, blue countermeasure column, large blue arrow, and green bottom goal bar. Add an orange label reading Flux.2 Flex near the left issue column. Content to preserve conceptually: the comparison should clearly reference DX Report 2025 cliff, with the same core flow from current problems to countermeasures and the 2030 GDP growth target. Make the top-left panel the most accurate and dense; make the other three panels visibly more simplified and less text-faithful, as a model-comparison visual. Constraints: Use exactly 4 panels and exactly 4 orange model labels. Keep the Japanese infographic style readable where possible, with no extra watermark or unrelated objects.
Content: Structure: 16:9 white-background 2×2 collage, four panels each showing a different model's reproduction of the same Japanese DX Report infographic. Each panel has distinct style (faithful, ponchi-e, distorted simplified, beige simplified), layout, colors, and orange model label. Reference image as source.
Pros: Clear comparison structure for easy visual model output comparison. Well-defined panel layout with proper label placement.
Cons: Heavily reliant on reference image; cannot generate without it. Dense text may cause blurriness and poor readability at small sizes.
Reference image: Observable reliance on reference image
Curated from publicly available creative examples. Prompts and commentary are edited and organized by this site. Please contact us with any rights concerns. Copyright & Privacy