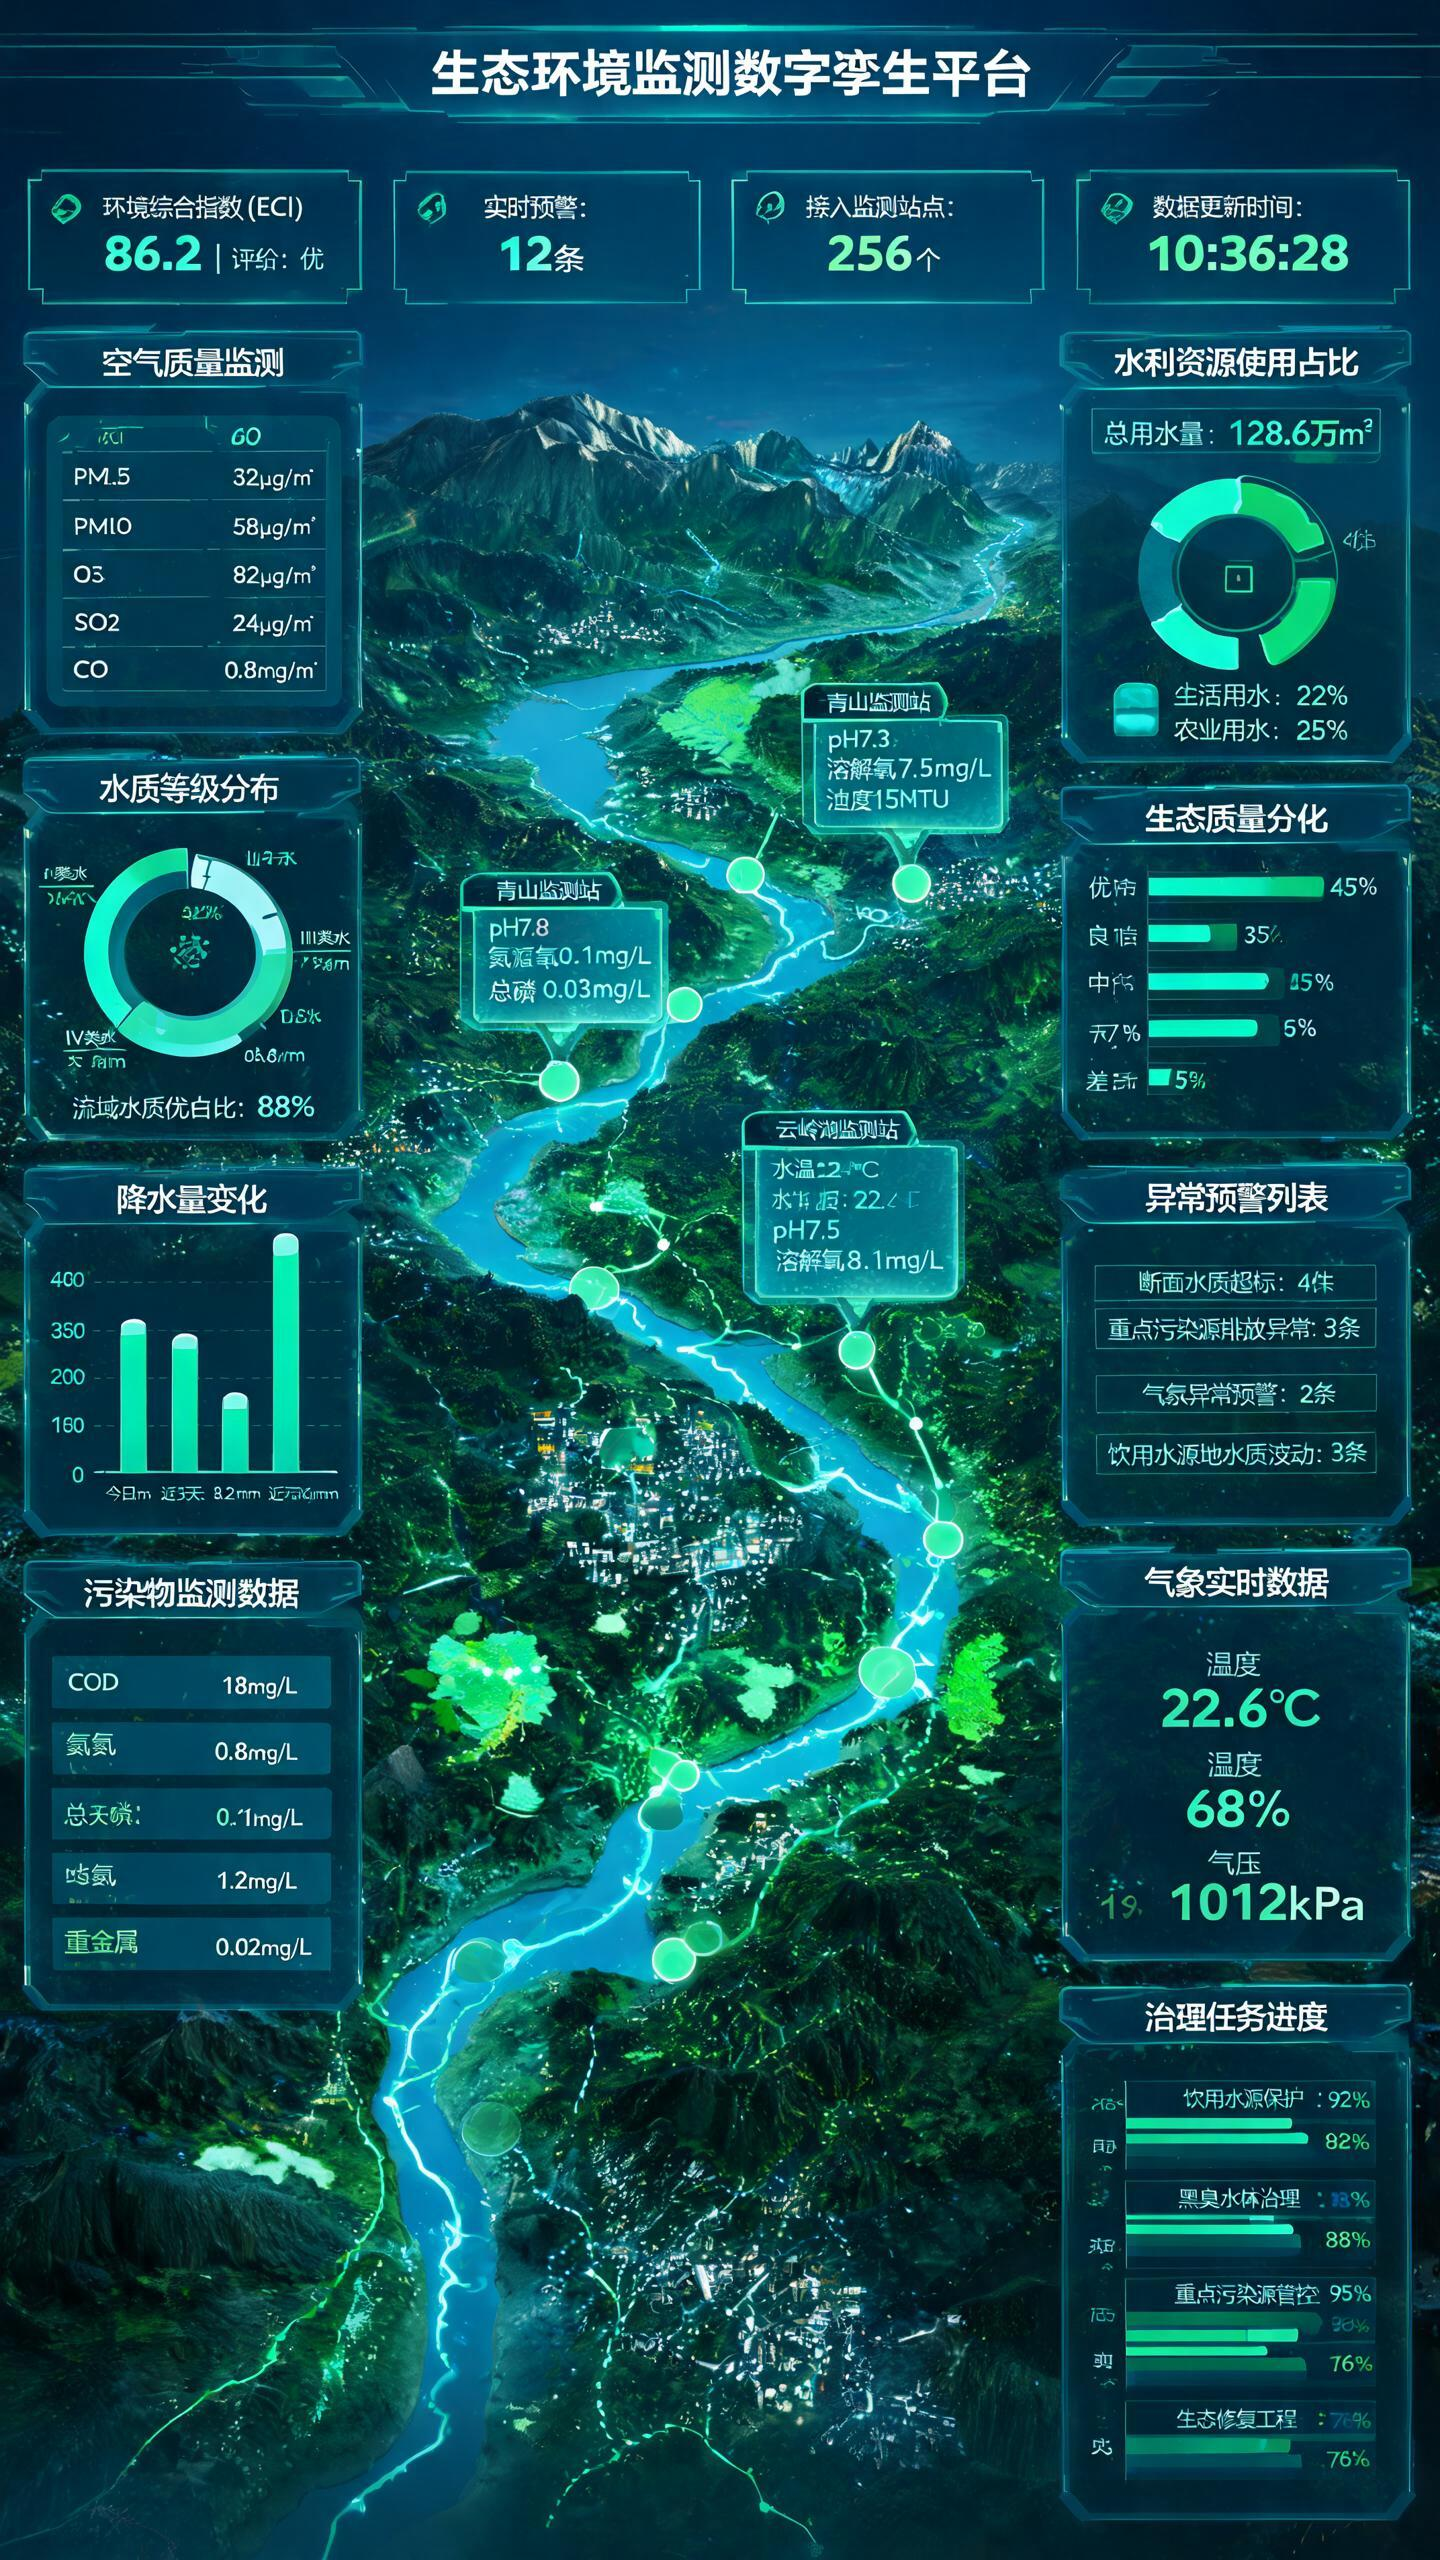
Ecological Environment Monitoring Digital Twin Platform AI Image Prompt
A futuristic eco-environment and water resource monitoring data dashboard, overall continuing the deep sea blue, ecological green, and cyan glowing UI style of the reference image. In the center is a high-precision 3D digital twin model of watershed terrain, containing mountains, rivers, lakes, reservoirs, cities, and ecological conservation areas. River systems run through the whole map as glowing flow lines, with multiple monitoring points and floating data cards distributed. The top title is "Ecological Environment Monitoring Digital Twin Platform". Top core information shows the comprehensive environmental index (ECI) 86.2, rating "Excellent", 12 real-time alerts, 256 connected monitoring stations, data update time 10:35:28. The left-side modules successively display: air quality monitoring, AQI 62, rating "Good", and shows PM2.5 32ug/m3, PM10 58ug/m5, 03 82ug/m5, S02 12ug/m5, NO2 24ug/m2, CO 0.8mg/m3; ring chart of water quality grade distribution, showing class l water 42%, class I water 28%, class water 18%, class IV water 7%, class V water 3%, and marks the proportion of excellent/good watershed water quality as 88%; bar chart of precipitation changes, showing today 12.6mm, recent 3 days 8.2mm, recent 7 days 46.8mm; pollutant monitoring data table, showing COD 18mg/L, ammonia nitrogen 0.8mg/L, total phosphorus 0.11mg/L, total nitrogen 1.2mg/L, heavy metals 0.02mg/L. The right-side modules successively display: water resource usage proportion, total water usage 1.286 million m3, of which domestic water 22%, agricultural use Wangtaibu water 25%; bar chart of ecological region divergence, showing ecological quality excellent 45%, good 35%, medium 15%, poor 5%; anomaly alert list, showing 4 sections exceeding water quality standards, 3 key pollution source emission anomalies, 2 weather anomaly warnings, 3 drinking water source quality fluctuations; meteorological change chart, showing temperature 22.6°C, humidity 68%, air pressure 1012hPa; governance task progress bar chart, showing drinking water source protection 92%, black-odorous water treatment 88%, key pollution source control 95%, ecological restoration project 76%. Multiple monitoring points on the central map pop up floating data cards, e.g. "Longxi Water Station: pH7.3, dissolved oxygen 7.5mg/L, turbidity 15NTU", "Qingshan Monitoring Station: pH7.8, ammonia nitrogen 0.1mg/L, total phosphorus 0.03mg/L", "Yunling Lake Monitoring Station: water temperature 22.4°C,
Content: Structure: theme (dashboard) + style based on reference image + central 3D twin model + top metrics + left/right data modules with charts/lists/cards + popups. Highly detailed with exact values.
Pros: Clear structure with complete data layers; explicit style direction
Cons: Overly specific, limiting creative freedom; contains typos and inconsistent data
Reference image: Explicitly relies on the reference image
Source materials are collected from publicly accessible web pages. Contact us if a rights issue needs review. Copyright & Privacy